Dashboard tour
Every node with an HTTP address serves a dashboard. When the node is on a hub, its dashboard also shows and manages every other node on that hub, so you can work from whichever node is closest.
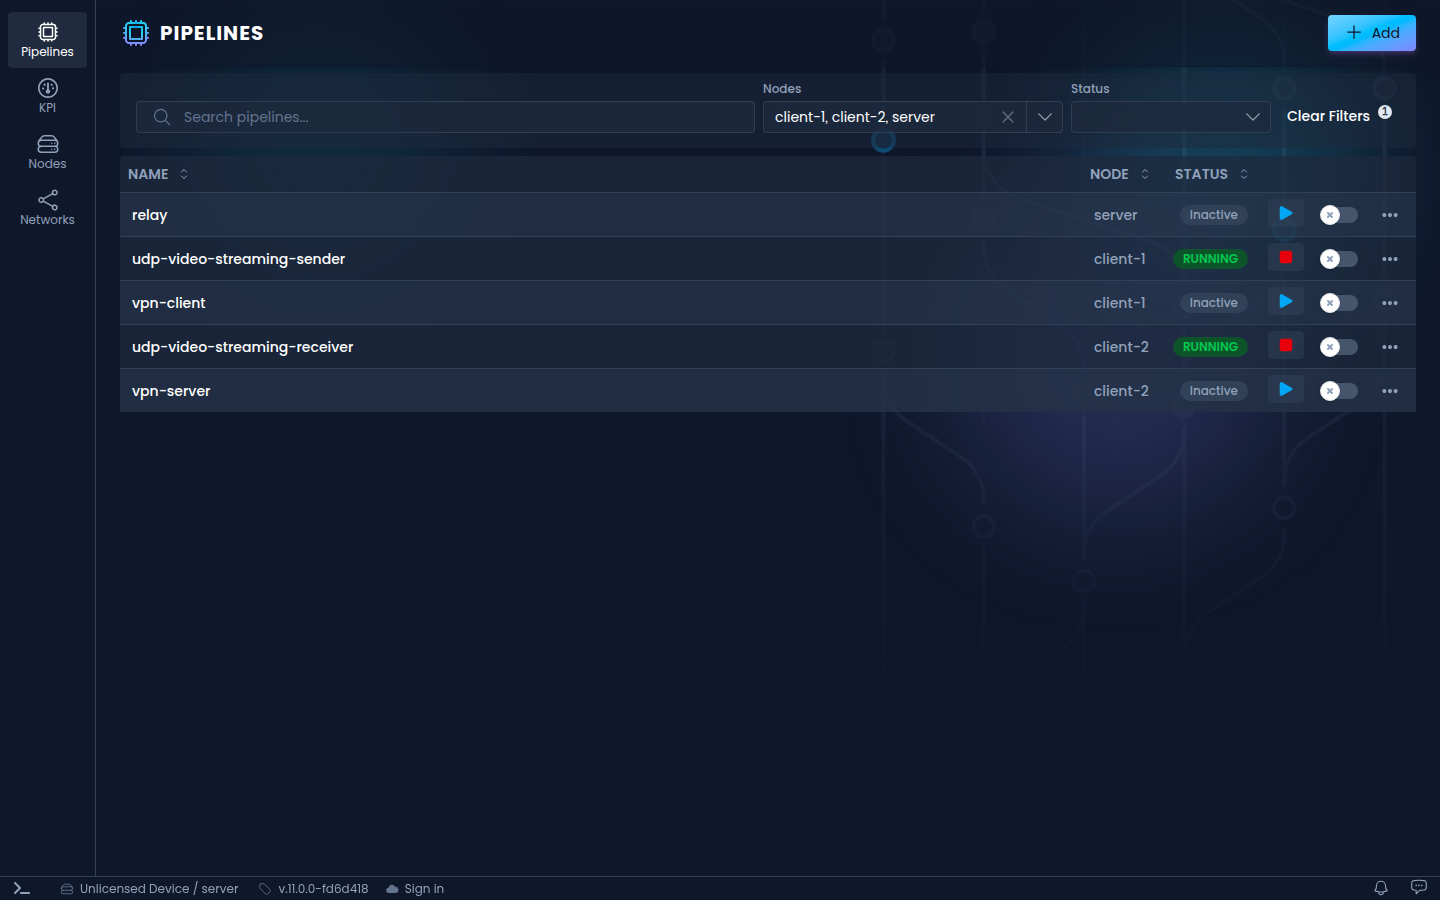
One dashboard for every node
The dashboard of a single node is enough to control every node on its hub. Open the dashboard of a node you can reach, such as your own hub server, and every other node is in its Nodes section: their pipelines, KPIs, networks, System, Log and Settings pages all open from there. The dashboard reaches those nodes through the hub, never through their own addresses.
So only the node whose dashboard you open needs an HTTP address. The others can run without one, which leaves no dashboard port open on them to expose or protect.
Sections
The sidebar on the left switches between the sections:
| Section | What you do there |
|---|---|
| Pipelines | List, add, start and stop pipelines on any node. Filter by node and status. See Creating a pipeline. |
| KPI | Watch the KPIs of all running pipelines in one place. See KPIs. |
| Nodes | See every node on the hub, whether it is connected and the version it runs. See Nodes. |
| Networks | Create and manage networks. Shown when a node on the hub keeps networks. |
Nodes
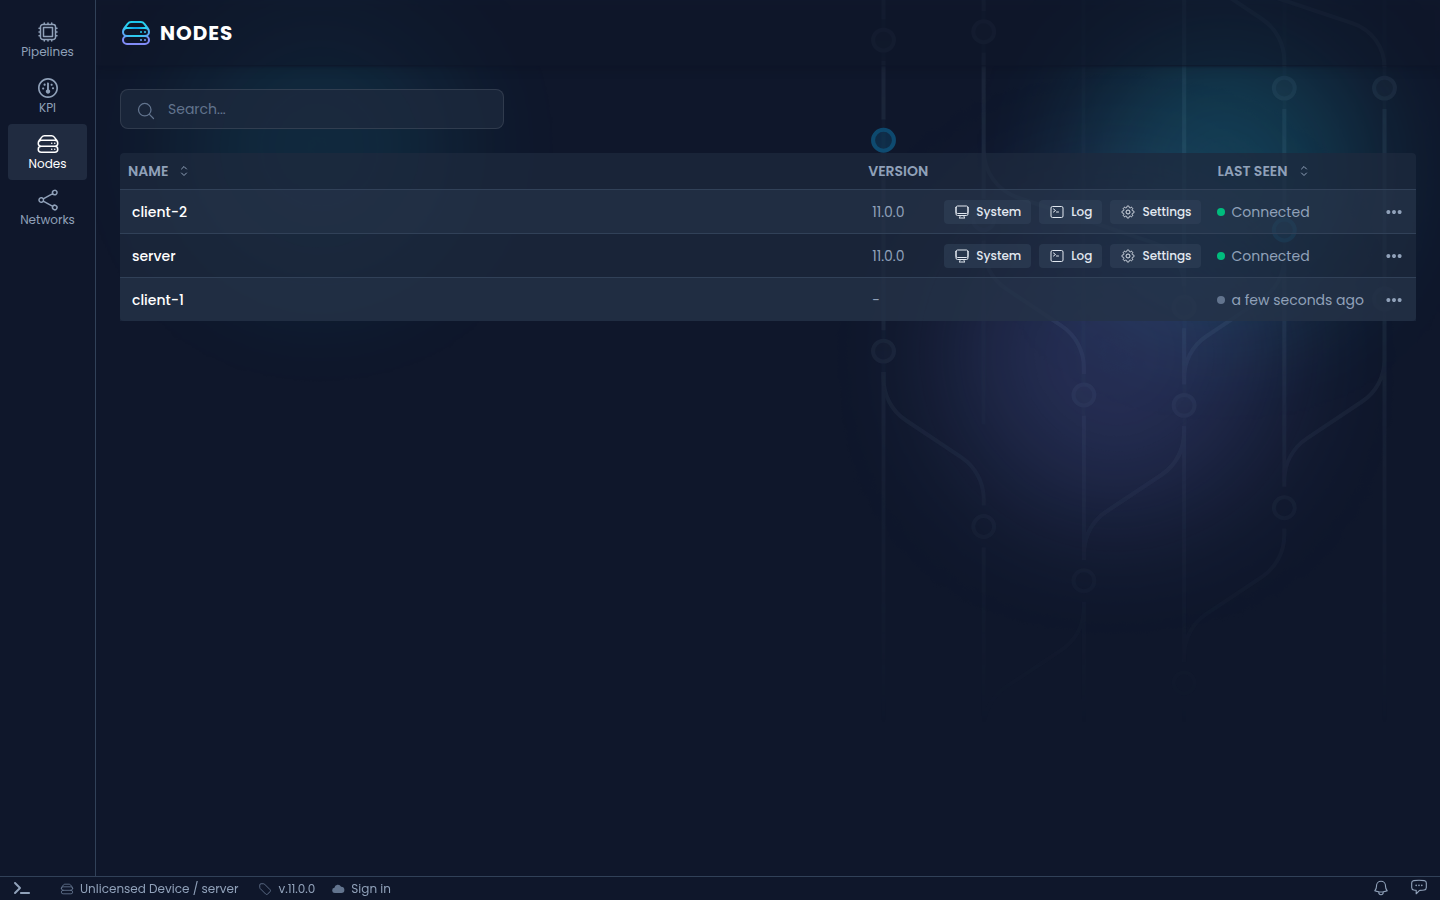
Each row shows the version the node runs while it is online. A node the hub turned away the last time it connected shows Needs update if its version of NanoPing is too old for the hub, and has to be updated to join again, or Refused for any other reason. Hover it for the reason.
Each online row has shortcuts to that node's pages:
- System: CPU, memory and disk usage, and the node's network interfaces. Expand an interface to see its live network flows.
- Log: the node's own log.
- Settings: the node's settings, on pages picked from the menu on the left:
- General: the node's name, error reporting, metric decimal places and the telemetry poll interval.
- Hub Connection: the hub the node is on and Leave hub, or, on a node on no hub, Join Cloud Hub and Your own hub.
- Network: the Default Carriers the node uses when it joins a network.
- Updates: the version the node runs, its channel, automatic installs, backups and free space. See Update.
On a hub server, the ⋯ menu of a row can remove the node from the hub.
Status bar
The bar along the bottom shows, from left to right:
- Command palette: opens the command palette.
- Node: your organization and the name of the node whose dashboard you are on. Click it to open the device in your NanoPing account.
- Version: the NanoPing version. Click it for the Releases page, which lists every release your organization can get, on stable and on its channels, with their release notes. New version available shows next to it while the node's channel has a newer release. See Update.
- Hub: Cloud Hub, or
hub:and the name of your own hub server, with a dot that is green while the hub is online and red while it is not, or Connect to hub if the node is on none. Click it to open the Hub Connection page of Settings. - Sign in or Cloud library: sign in to your NanoPing account to store pipelines in the cloud library and add them to any node.
- Notifications and Give feedback, on the right.
Command palette
The command palette lists every command with its keyboard shortcut. Open it with Ctrl + Shift + P (⌘ + Shift + P on macOS), then type to search.
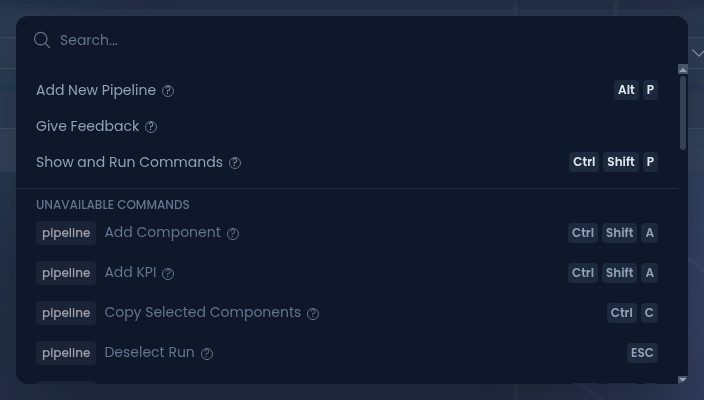
Commands that do not apply to the current page are listed under Unavailable commands, so the palette doubles as an overview of all shortcuts.