KPI types
Every KPI has these fields, whatever its type:
| Field | Description |
|---|---|
| Label | The title of the tile. |
| Description | Shown when you hover the ⓘ on the tile. |
| Column Span | Optional. How many columns the tile spans, from 1 to 6. Each type has a sensible default. |
The other fields depend on the type. Fields that hold an expression refer to metrics by their variable names. Optional fields are marked as such.
The node keeps the KPIs of a running pipeline whether or not anyone is watching. The over-time types start out with what it kept, for the last 24 hours by default, and go on from there. See pipelines.kpiHistoryRetentionMinutes to keep them for longer or shorter. A long history is drawn as the lowest and highest value of each stretch of time, so its peaks still show, and the graph is left blank where nothing was kept.
Changing the types, expressions or variables of the KPIs of a running pipeline restarts it, so all of a run's KPIs are evaluated the same way. Labels, order, units and how a KPI is shown change without a restart.
Value
A single value as text. Use it when only the current value matters.

| Field | Description |
|---|---|
| Expression | The value to show. |
| Unit | Optional. For example ms or packets. |
Gauge
A single value as a gauge from 0 to 100 %, for percentages such as loss or utilization.

| Field | Description |
|---|---|
| Expression | The value to show, from 0 to 100. |
Value over time
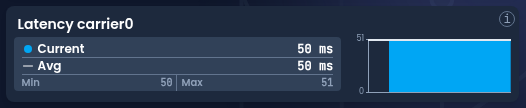
A value plotted over time, with its current, average, minimum and maximum.
| Field | Description |
|---|---|
| Expression | The value to plot. |
| Unit | Optional. For example ms. |
| Min Expression, Max Expression, Avg Expression | Optional. Expressions for the minimum, maximum and average. Calculated from the data when left out. |
Value over time comparison
Two values over time, each on its own graph, so they can be compared without sharing a scale.

| Field | Description |
|---|---|
| Value1 Expression, Value2 Expression | The two values to plot. |
| Unit | Optional. |
| Value1 Text, Value2 Text | Optional. The captions of the two graphs. Default to BEFORE and AFTER. |
| Value1/Value2 Min, Max and Avg Expression | Optional. As for Value over time. |
Data rate
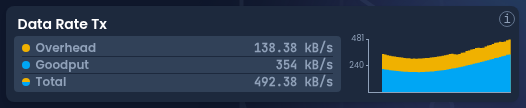
A data rate over time, split into goodput (the useful data) and overhead (repair packets, retransmissions and headers).
| Field | Description |
|---|---|
| Goodput Expression | The goodput. |
| Overhead Expression | The overhead. |
| Type | Optional. Whether the metrics are a RATE, in bytes per second, or an accumulated TOTAL in bytes, which the KPI turns into a rate per second. |
Multiple values over time
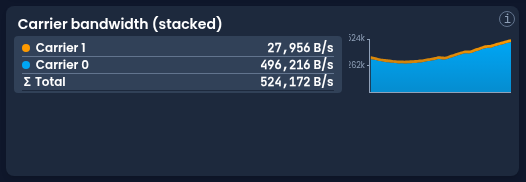
Several values plotted over time on the same graph, stacked or as lines.
| Field | Description |
|---|---|
| Values | The values to plot, each with an Expression, a Label and optionally a Description and Color. The first value is the bottom one. |
| Unit | Optional. |
| Graph Type | Optional. AREA_STACK (the default) or LINE. |
Multiple values
Several values side by side as bars.

| Field | Description |
|---|---|
| Values | The values to show, each with an Expression, a Label and optionally a Description and Color. The first value is on the left. |
| Unit | Optional. |
Value to text
Shows a text for the current value, looked up in a table. Use it to turn states into words, such as merged into Merged.

| Field | Description |
|---|---|
| Expression | The value to look up. |
| Mapping | For each value, the Text to show and optionally its Color. |
Value to text (conditions)
Shows the text of the first condition that is true. Use it when a state depends on a comparison, such as a threshold.

| Field | Description |
|---|---|
| Conditions | Each with an Expression that is true or false, the Text to show when it is true, and optionally a Color. |
Enum metrics hold the name of their value, so compare and map names, not numbers: source_viability_control == "merged" in a condition, and merged in a mapping.
Headline
A title above a group of KPIs. It has only a label.

See the JSON schema for how KPIs are stored in a pipeline.